
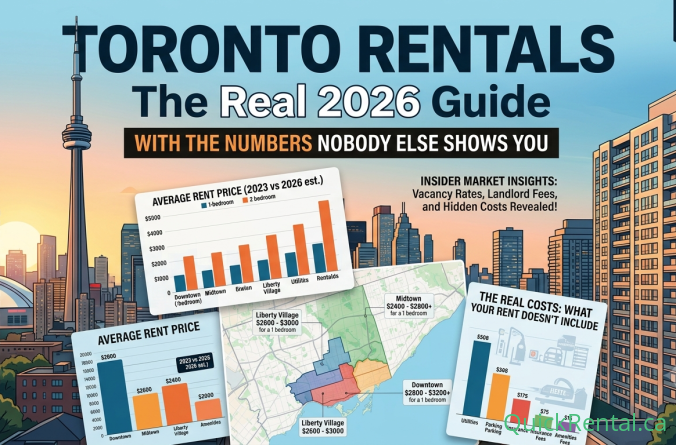
Toronto rentals confuse people. Not because finding a listing is hard — there are thousands of Toronto rentals live on any given day — but because pricing swings so wildly block to block that two people renting a "1-bedroom in Toronto" can end up paying $700 apart for basically the same square footage. This guide breaks down Toronto rentals by area, walks through the actual survey numbers from CMHC and the major rent-tracking firms, flags the pitfalls that catch new renters off guard, and answers the questions people search for most.
The State of Toronto Rentals Right Now
Let’s start with what the data actually says, because a lot of what gets repeated about Toronto rentals online is outdated or just wrong.
CMHC’s most recent Rental Market Survey put Toronto’s purpose-built vacancy rate at 3.0% — the first time it’s crossed that mark since the pandemic. That matters because Toronto rentals have historically stabilized at much lower vacancy than other big Canadian cities. Even a small bump in vacancy tends to take real pressure off asking rents here, more than the same bump would in a market like Calgary.
Zumper’s July 2026 tracking has the average rent across Toronto rentals sitting around $2,419/month, down roughly 3% year-over-year. Broken out by size, 1-bedroom Toronto rentals average close to $2,097, and 2-bedroom units run around $2,650. CMHC’s turnover-rent data tells a similar story: after peaking near $2,202 in May 2024, asking rents on Toronto rentals have pulled back roughly 8% as new supply came online and international student demand softened.
The condo side of Toronto rentals is a separate animal entirely. Roughly 40% of condo apartments in the Toronto CMA are rented out, and condo 2-bedrooms run about 41% higher than purpose-built 2-bedrooms ($2,891 vs. $2,046, per CMHC). If you’re comparing two Toronto rentals and one is a condo, expect to pay a premium for the extra amenities and newer finishes.
How the Toronto Rentals Numbers Actually Get Measured
Worth understanding before you trust any number you read about Toronto rentals: there are two very different measurements floating around, and articles rarely specify which one they’re using.
Average rent (sometimes called the non-turnover or in-place rent) reflects what all tenants are currently paying across occupied units, including people who’ve lived there for years under rent-controlled increases. This number moves slowly because it’s weighted down by long-term tenants paying below-market rates.
Asking rent (or turnover rent) reflects what a landlord is charging today for a unit that just became vacant. This is the number that actually tells you what you’d pay if you moved into Toronto rentals this month, and it moves much faster in both directions — up during tight markets, down during softer ones like the current stretch.
CMHC conducts its official Rental Market Survey once a year, every October, canvassing purpose-built rental buildings across the city. Private firms like liv.rent and rentals.ca publish more frequent, monthly snapshots pulled from active listings, which react faster to market shifts but skew toward asking rent rather than the full occupied-unit average. When you see wildly different numbers quoted for Toronto rentals in the same month, this is almost always why — one source is measuring sitting tenants, the other is measuring what’s advertised right now.
This distinction matters most if you’re already living in a rent-controlled unit. Your actual rent increase is capped by Ontario’s guideline, regardless of what asking rents for comparable Toronto rentals are doing in your building. But if you’re moving, the asking-rent numbers are the ones that matter to your budget.
Toronto Rentals by Area: A Real Comparison
Here’s where Toronto rentals actually diverge, and where most generic guides fall short — they treat Toronto as one market when it’s really a dozen smaller ones stitched together.
Downtown / Toronto Central This is the most expensive tier of Toronto rentals, full stop. CMHC pegs the Toronto Central zone around $2,163/month average, and 1-bedroom Toronto rentals near Union Station commonly list between $2,400–$2,650. You’re paying for the subway on your doorstep, walkability, and density — parking alone can tack on another $200–$350/month on top of rent.
North York Mid-to-upper tier Toronto rentals, with a wide spread depending on proximity to the Yonge subway line. In early 2026, North York posted the highest rent-per-square-foot of any zone tracked in Ontario’s rent report, even edging out downtown some months. Newer builds along Yonge and Sheppard drive that number up.
Scarborough Scarborough remains one of the more affordable pockets of Toronto rentals, though it’s tightened up. Rent-per-square-foot has run as high
as $3.48–$3.58, competitive with downtown on a per-foot basis even though total rents are lower because units skew smaller. Scarborough saw one of the sharpest year-over-year corrections of any zone recently, with 1-bedroom unfurnished Toronto rentals dropping from roughly $2,129 to $1,934 over twelve months — a real opening for renters willing to trade commute time for savings.
Etobicoke Etobicoke rentals sit close to Scarborough on price, generally $1,800–$2,100 for a 1-bedroom, with 2-bedrooms in the $2,200–$2,500 range. Etobicoke South specifically has shown some of the lowest average rents of any zone within Toronto proper, per CMHC’s zone breakdown. Bloor-Danforth line access keeps it connected without downtown pricing.
East York Smaller rental inventory than the other zones, but East York Toronto rentals tend to price close to the midtown average, with older purpose-built stock offering some of the better value-per-square-foot if you don’t need a brand-new building.
York / Weston-Mount Dennis One of the more affordable corners of Toronto rentals, especially since the Eglinton Crosstown LRT opened up new transit options here. 1-bedroom listings starting around $1,700 aren’t unusual, though inventory is thinner than in bigger zones.
Here’s the quick-comparison view:
| Area | Typical 1-Bedroom Range | Positioning |
|---|---|---|
| Downtown/Central | $2,400–$2,650 | Priciest tier of Toronto rentals |
| North York | $2,100–$2,500 | High rent-per-sq-ft, subway access |
| Scarborough | $1,700–$2,000 | Softened recently, good value |
| Etobicoke | $1,800–$2,100 | Steady, transit-connected |
| East York | ~$2,000 | Smaller inventory, solid value |
| York/Weston | $1,700+ | Most affordable, growing fast |
Pitfalls to Watch For in Toronto Rentals
A few things trip up renters over and over again in this market:
Rent control cutoff confusion. Ontario’s rent control guideline (2.5% for 2026) only applies to buildings first occupied before November 2018. A huge share of newer Toronto rentals — especially condo units — fall outside that protection entirely, meaning a landlord can raise rent by any amount between tenancies. Always ask when the building was first occupied, not just when it was built.
Turnover rent vs. sitting-tenant rent. The rent a current, long-term tenant pays and the rent advertised for a newly vacant unit in the same building can differ by hundreds of dollars. CMHC’s own data shows turnover rents driving most of the recent rent growth in Toronto rentals, even while sitting-tenant increases stay capped by the guideline. Don’t assume the listed price reflects what a neighbour is paying — it usually doesn’t.
Unregistered basement units. Basement Toronto rentals can be excellent value, often $1,200–$1,800 below comparable full apartments, but a meaningful share aren’t legally registered with the city. An unregistered unit can mean no fire separation, no legal second exit, and zero recourse if something goes wrong. Ask directly and verify before signing.
Condo vs. purpose-built pricing traps. Because condo Toronto rentals run roughly 40% higher than purpose-built for a comparable 2-bedroom, renters sometimes anchor their budget to whichever type they saw first and get sticker shock switching between the two. Know which category you’re comparing before you set expectations.
Scam listings. Toronto’s rental demand makes it a target for fake listings, usually underpriced units with photos lifted from elsewhere and a landlord who’s conveniently "out of the country" and wants a deposit wired before a showing. If you can’t view the unit in person or via a live video call, don’t send money.
Utilities that aren’t actually included. Older purpose-built Toronto rentals often bundle heat and water into the rent, while condo units almost always bill hydro separately through Toronto Hydro, typically adding $60–$150/month. Listings don’t always spell this out clearly, so confirm exactly what’s included before comparing two units on price alone — a "cheaper" condo can end up costing more once utilities are factored in.
Comparing rent-per-square-foot instead of total cost. Some of the priciest-looking zones for Toronto rentals on a per-square-foot basis, like North York or downtown, actually offer smaller average unit sizes, which can make total monthly cost more competitive than the headline number suggests. Always compare total rent for the layout you actually need, not just the per-square-foot rate.
Frequently Asked Questions About Toronto Rentals
What’s the average rent in Toronto right now? As of mid-2026, the citywide average across Toronto rentals sits around $2,400–$2,420/month, with 1-bedrooms averaging roughly $2,000–$2,100 and 2-bedrooms closer to $2,650, depending on the data source and whether condo units are included.
Which area has the cheapest Toronto rentals? Scarborough, York, and parts of Etobicoke South consistently show the lowest average rents within the city, sometimes 20–30% below downtown pricing for a comparable unit size.
Is Toronto’s rental market cooling down? Yes, relative to the 2022–2023 peak. Vacancy has risen to around 3%, the highest outside the pandemic period since 2004, and turnover rents have pulled back from their 2024 highs as new supply came online and demand softened.
Do all Toronto rentals have rent control? No. Only units first occupied before November 15, 2018 fall under Ontario’s rent increase guideline. Newer buildings and most condo rentals are exempt, so landlords can set new rents freely between tenants.
How much income do I need to afford an average Toronto rental? Using the standard 30%-of-income guideline, you’d need roughly $97,000–$99,000 in gross annual income to comfortably afford an average 1-bedroom in Toronto without being cost-burdened, based on current pricing.
Where to Start Your Search
Toronto rentals move fast, and pricing shifts month to month depending on the zone. The best approach is comparing multiple areas rather than fixating on one neighbourhood, since a 15-minute difference in commute can mean hundreds of dollars in savings. Browse current listings on the QuickRental properties page to compare what’s actually available across Toronto right now, and check the news section for ongoing market updates as Toronto rentals continue to shift through 2026.
References
- CMHC, 2026 Mid-Year Rental Market Update
- CMHC, 2025 Rental Market Report
- CMHC Rental Market Survey, Toronto zone data
- Zumper, Average Rent in Toronto, ON and Rent Price Trends
- liv.rent, January 2026 Ontario Rent Report
- liv.rent, February 2026 Ontario Rent Report
- liv.rent, March 2026 Ontario Rent Report
- WealthNorth, Toronto Rental Market Data 2026
- Rentals.ca, July 2026 National Rent Report